case study · Data & AI
Arce
Market intelligence on Uruguay’s public procurement.
Every AI answer is stored together with the exact figures it saw. Any conclusion can be traced back to the number behind it.
Arce gathers the history of Uruguay’s public purchases (what was awarded, to whom, at what price and which agency bought it) and turns it into comparable statistics: which products are worth selling, at what price bids are won and who the competition is. An AI model reads those figures and writes the analysis for management, without computing anything on its own.
01 · business problem
Arce started out doing something else: reading the state procurement portal (ARCE) every 15 minutes and telling the company which open aluminum tenders were worth bidding on. That part still runs.
Then management asked a bigger question: not which tender is useful today, but what is worth selling to the State, at what price and against whom. Open tenders in one field cannot answer that. It takes the full history of awards, for every product, compared honestly.
02 · constraints
What I had to work around.
No data yet
Bulk download of the history will be a separate service. This system had to be ready to receive it and produce the statistics on its own, with no manual work, as soon as batches arrive.
Public data, but messy
Pesos, dollars and indexed units; kilos, liters and reams; prices with and without taxes; cancelled tenders; suppliers that sometimes come without a tax ID. Comparing that without normalizing is comparing noise.
Millions of rows
With the full history, rankings cannot be computed on every query.
Numbers that hold up
The conclusions go to management to decide what to sell. A figure with no source, or an AI that makes things up, is useless.
the key decision
The numbers come from SQL. The AI interprets them, it does not compute them.
The tempting route was to hand the data to a model and ask for conclusions. But a model that computes can be wrong without anyone noticing, and there is no way to reproduce how it got to a number.
So the statistics are computed in PostgreSQL and the model only receives a package with the figures already done. It answers with a fixed schema and cites numbers, the products it mentions are checked against the package, and every answer is stored with what it saw.
03 · technical decisions and why
Why it is built this way.
Tolerant contract, strict structure
The ingestion API accepts what the portal shows (decimal commas, dd/mm/yyyy dates, the currency as written) and normalizes it. But an item with no number or an award with no supplier is rejected with the error detail, per tender, without dropping the whole batch.
Each tender travels whole
A tender arrives with its items, bids and awards and replaces its previous version in one transaction. The raw payload is stored with a hash: repeats are not reprocessed and, if the rules change, everything is rebuilt from the raw data without scraping again.
Compare only what is comparable
Everything in Uruguayan pesos before tax, using the exchange rate of each award’s date. Prices are compared only within the same unit, without cancelled tenders, and with medians and percentiles instead of averages.
Precomputed statistics
Eight materialized views in PostgreSQL, built on one row per award. They refresh on their own a minute after the last batch and every night, without blocking the dashboard.
An opportunity index in plain sight
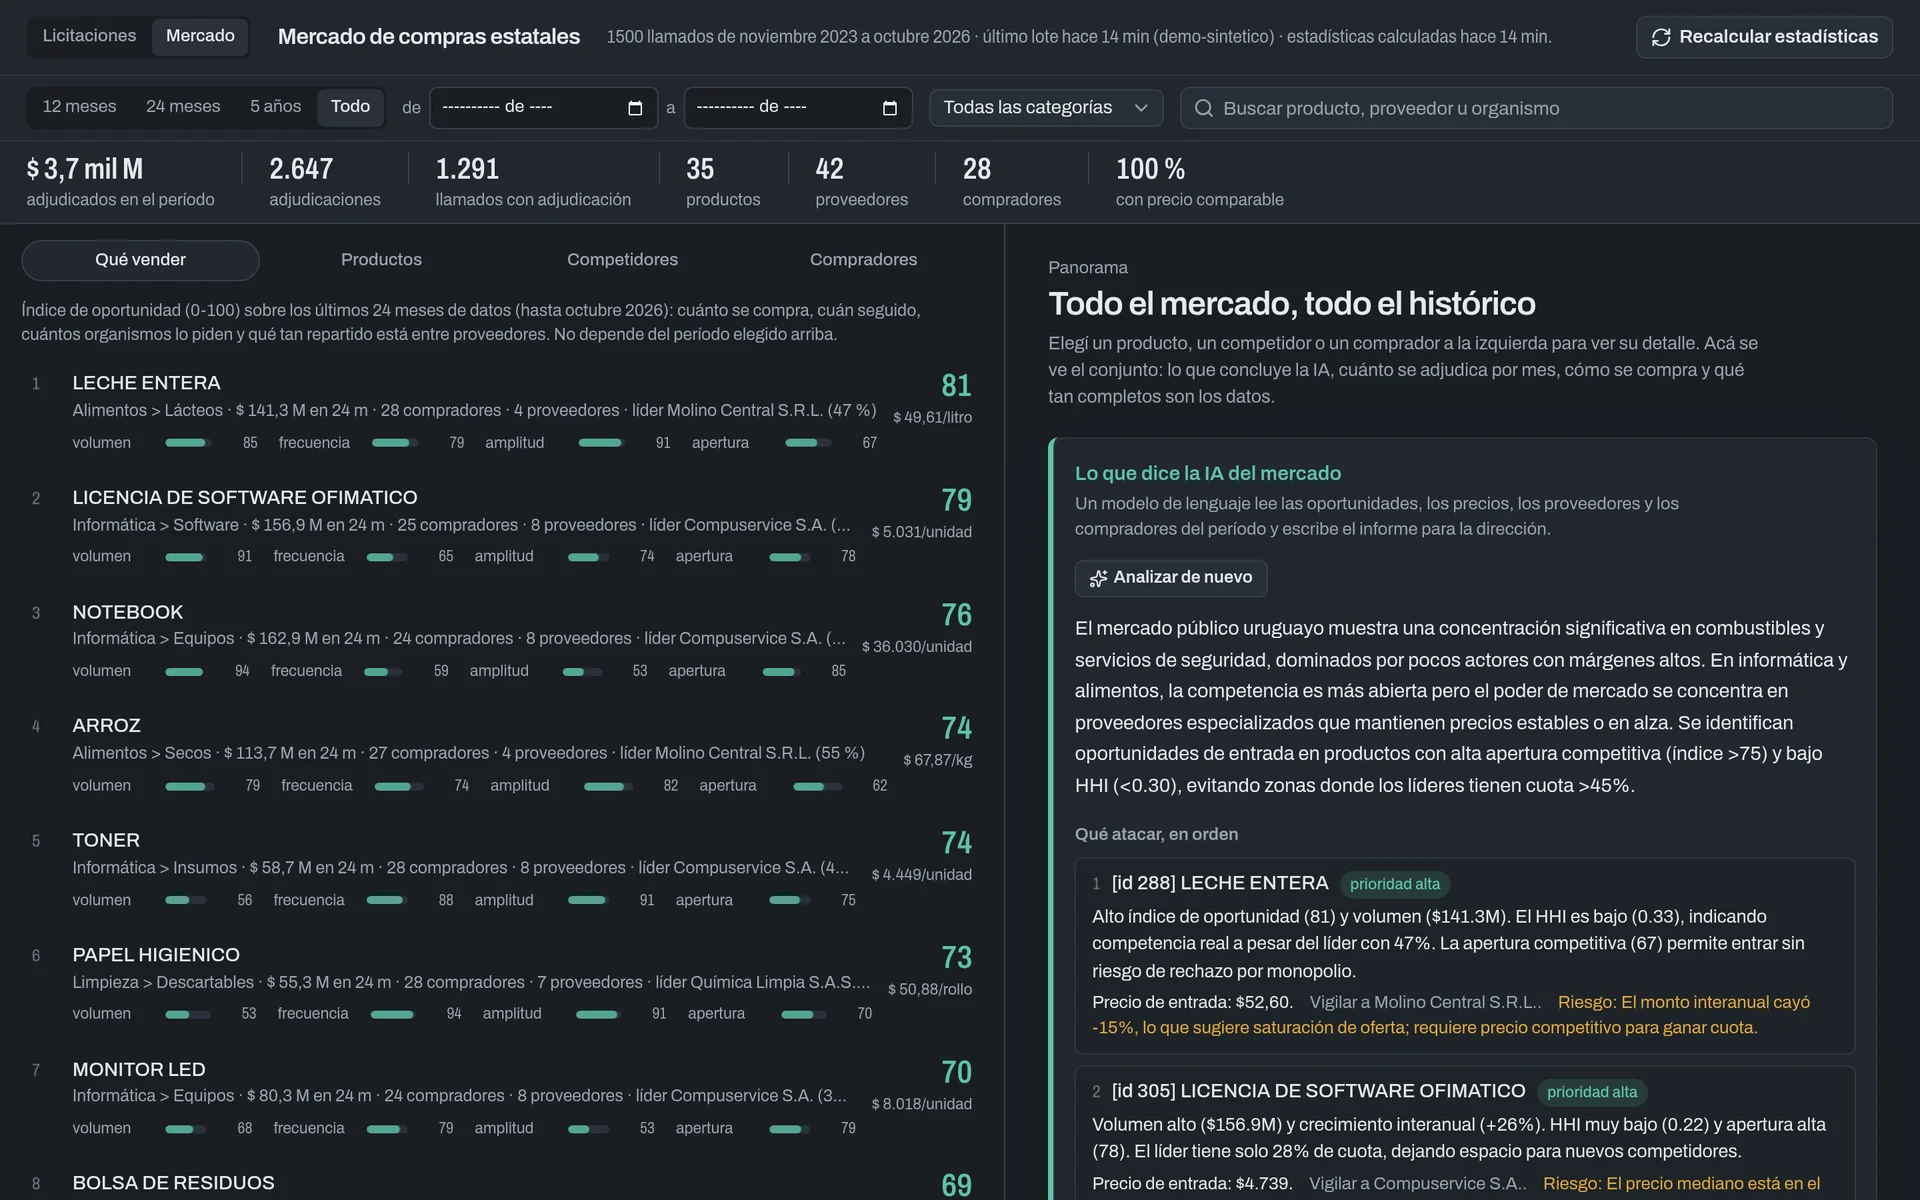
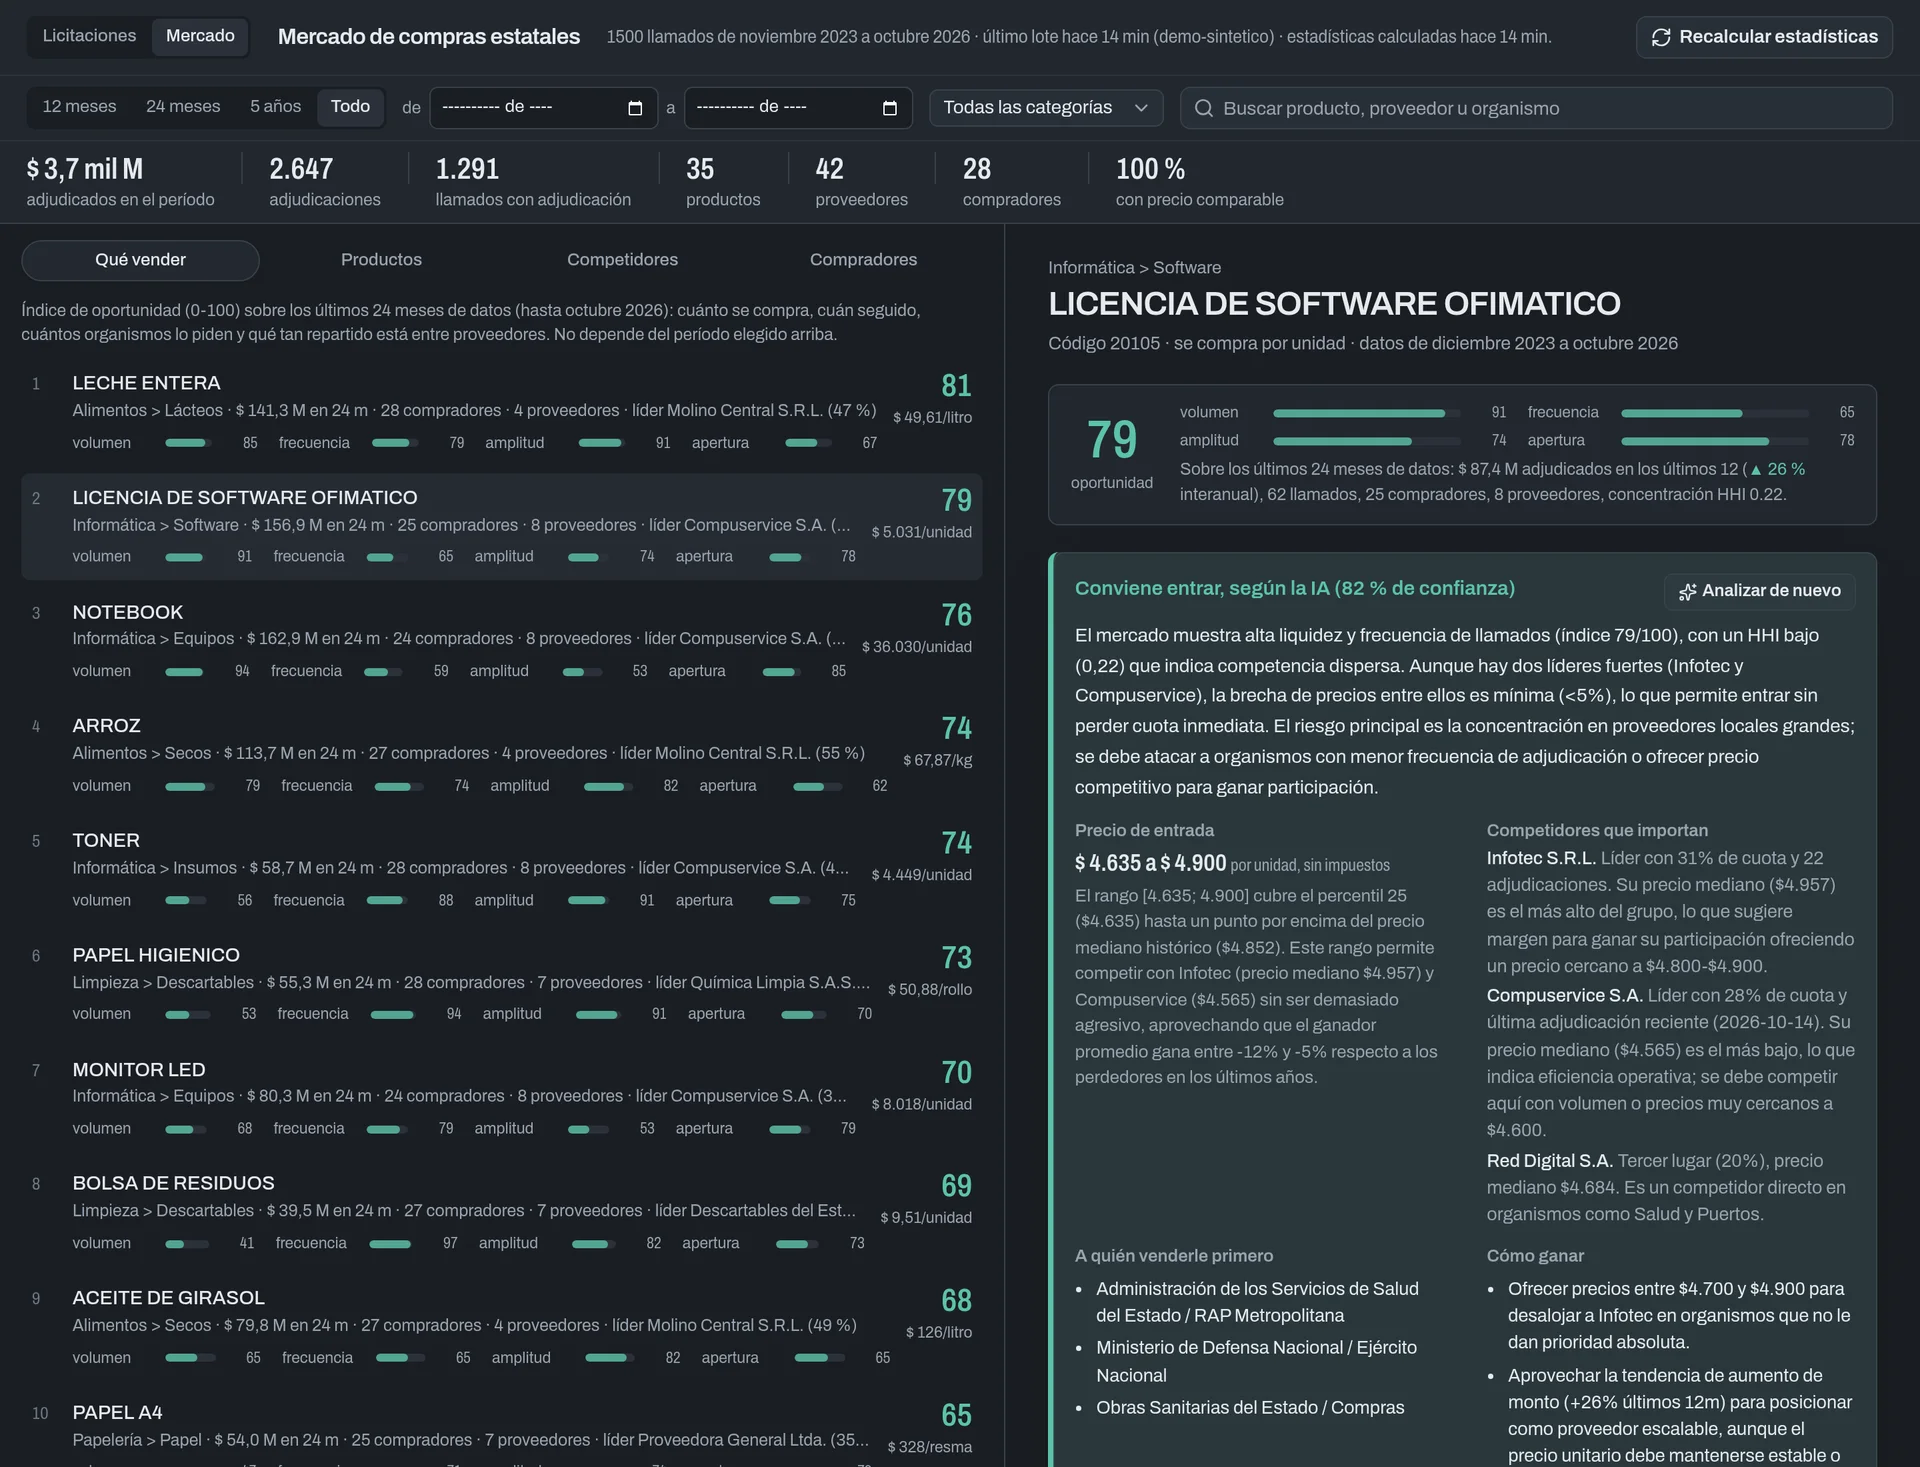
A 0–100 score per product combining volume, frequency, how many agencies buy it and how spread it is across suppliers. The weights are one line of SQL and the dashboard shows all four components.
Same model, local or in the cloud
The analyst uses the provider the rest of the system uses: Ollama on CPU (one to three minutes per report) or the Anthropic API (seconds). The data package is trimmed to each model’s context.
04 · what was discarded
What I ruled out along the way.
Letting the AI compute
Faster to build, but the numbers cannot be reproduced or audited. The model reads figures; it does not produce them.
Averages
A single mistyped price on the portal drags the whole statistic. Medians and percentiles absorb it.
A trained scoring model
With no real data yet, a visible formula that is tuned in one line is more honest than a black box. The real market has to be seen first.
One endpoint per entity
Items, bids and awards sent separately made the scraper’s job harder and made it hard to resend a batch without duplicating anything.
what was built
From raw data to a recommendation backed by figures.
- 01
Ingestion API
Receives batches of historical tenders with a token, validates them against a contract published as JSON Schema and stores the raw payload.
- 02
Normalization
Suppliers by tax ID, articles by ARCE catalog code, agencies, currencies and units brought to a single canon.
- 03
What to sell
Products ranked by opportunity index, with the breakdown of each score.
- 04
At what price
Winning price distribution per product and unit, monthly trend and, where the portal publishes the bid comparison, how much cheaper the winning bid was.
- 05
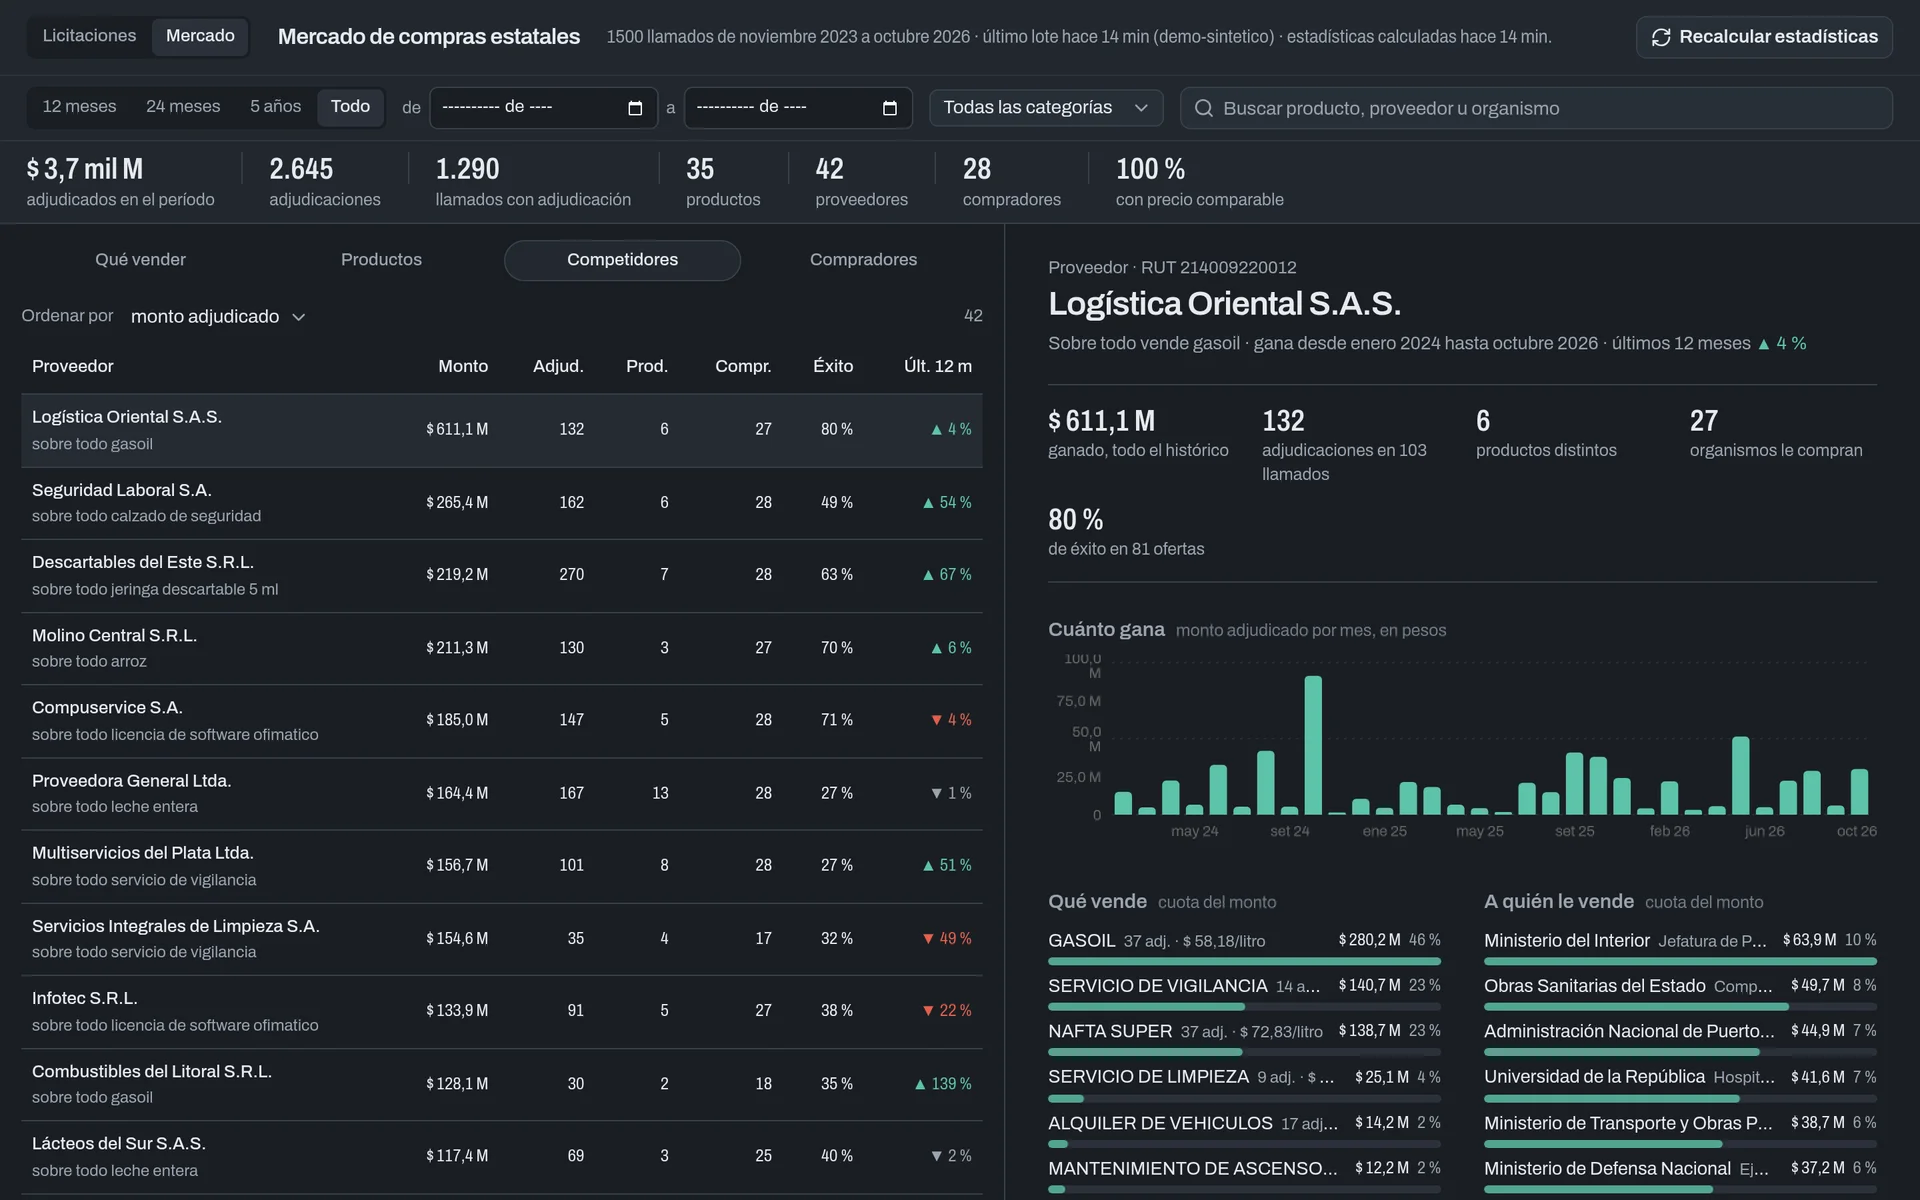
Who wins and who buys
Suppliers with their share, win rate and who they compete with; agencies with what they buy most.
- 06
The AI analyst
A market report for management, a verdict per product (enter, explore or avoid, with an entry price) and answers to free-form questions, always citing the data.
The first stage still lives in the same service: the field monitor reads the portal every 15 minutes, analyzes tender documents with AI and leaves them in a review inbox. What is missing is the history scraper; meanwhile, the dashboard was tested with three years of synthetic purchases sent through the same API.
architecture
How the data flows, from the batch to the dashboard.
History scraper (pending)
A separate service that walks the portal and sends batches of tenders through the API.
Ingestion
Token, Zod contract, raw payload with a hash and one transaction per tender.
Normalized PostgreSQL
Agencies, suppliers, articles, tenders, items, bids, awards and exchange rates.
Materialized views
One row per award in pesos before tax and, on top of it, prices, rankings and competition.
Analyst (Ollama or Anthropic)
Reads a package of figures and answers with validated JSON, stored next to the package.
API and dashboard
Express and React: what to sell, products, competitors and buyers.
It lives in the same Docker service as the field monitor, with its own module and database schema: the original pipeline was left untouched.
05 · result
What is up and running.
as soon as the scraper sends batches, the statistics refresh on their own, with no manual steps.
the products the AI mentions are checked against the data it received; those that do not exist are dropped.
the dashboard shows how much of the data has a comparable price and what was left out, and why.
with three years of synthetic purchases through the same API and an integration test against a real database.
screenshots
The dashboard, with demo data.
takeaways
- When the question changes, the data that matters changes: going from "is this tender for us?" to "what is worth selling?" moved the center of the system from the tender document to the award.
- The hard part of comparing prices is not the statistics but the normalization: currency, unit and taxes decide whether a number means anything.
- Separating who computes from who interprets lets the AI add value without becoming a source of unbacked figures.
- Building the receiver before the scraper, and testing it with synthetic data through the same door, validated the contract before the first real record.
Want to talk about this project?
The code is public. If you want to discuss the design or talk about a role, write to me.